Spatial Transcriptomics and Single-cell RNA-seq: Complementary Technologies for Next-Generation Biology
Discover how spatial transcriptomics and single-cell RNA-seq complement each other to drive next-generation biological insights. Learn about emerging platforms, multi-omics integration, and how Nygen Analytics empowers researchers to leverage both technologies.
In Part 1 and Part 2 of this blog series, we explored how single-cell RNA sequencing (scRNA-seq) revolutionized transcriptomics by cataloging cell types and states, and how spatial transcriptomics brought gene expression back to its native tissue context. Now, in Part 3, we look forwards. The future of transcriptomics lies in combining single-cell and spatial technologies – leveraging the strengths of each to answer questions that neither could alone. In this final installment, we discuss emerging multimodal platforms, advances in spatial resolution, machine learning methods for data integration, spatial multi-omics, and 3D tissue atlases. We’ll highlight how these developments are converging and how researchers will increasingly use both scRNA-seq and spatial data in tandem to drive biological discovery. Finally, we consider how platforms like Nygen provide a flexible hub to analyze and integrate these multimodal datasets, positioning scientists for the next generation of breakthroughs.
Emerging Multimodal Spatial Platforms
A wave of next-generation spatial transcriptomics platforms is pushing the boundaries of resolution, throughput, and multi-modality. These technologies are evolving alongside scRNA-seq and are explicitly designed to complement single-cell data. Some notable emerging platforms include:
- Slide-seqV2 – a bead-based spatial transcriptomics method that achieves near single-cell resolution (~10 µm) by capturing RNA onto barcoded beads (Meng et al., 2024). Slide-seqV2 dramatically improved on the original Slide-seq with ~10x higher RNA capture efficiency, allowing detection of many more transcripts per bead. This boosts sensitivity to the point where tiny tissue features and rare cell types can be resolved in situ. Slide-seqV2 bridges a previous gap: scRNA-seq gave rich gene profiles but lost spatial info, while earlier spatial methods had spatial data but lower gene capture. Now Slide-seqV2 offers both depth and location.
- Stereo-seq – an ultra-high-resolution approach using DNA nanoball (DNB) technology to capture transcripts on a patterned array (Fortner & Bucur, 2024). Stereo-seq achieves nanoscale resolution (down to sub-cellular levels) and can cover huge tissue areas (chips up to 13 cm across). This enables mapping an entire embryo or organ in one experiment with single-cell detail. Stereo-seq’s combination of field-of-view and resolution outpaces earlier arrays (for comparison, 10x Visium spots are 55 µm, capturing many cells. With Stereo-seq, one can zoom in to see individual cells and even subcellular transcript patterns across large tissue architectures – something impossible with dissociated single-cell sequencing alone.
- CosMx SMI (Spatial Molecular Imager) – a high-plex imaging-based platform from NanoString that simultaneously measures RNA and proteins directly in tissue. CosMx can image 1,000+ RNA transcripts and ~60–100 proteins in FFPE or fresh samples at single-cell and even subcellular resolution. It achieves this by iterative fluorescence imaging and sophisticated cell segmentation. CosMx exemplifies spatial multi-omics: providing both transcriptomic and proteomic maps in situ. NanoString’s first CosMx dataset mapped ~960 genes in ~800,000 cells of human lung tumor samples, identifying 18 cell types and their organization in the tumor microenvironment. Such rich datasets link gene expression to histology – something scRNA-seq can’t do alone. (Figure A and B below show portions of a CosMx output: raw in situ RNA/protein signals and cell segmentation boundaries, while C and D show derived single-cell maps).
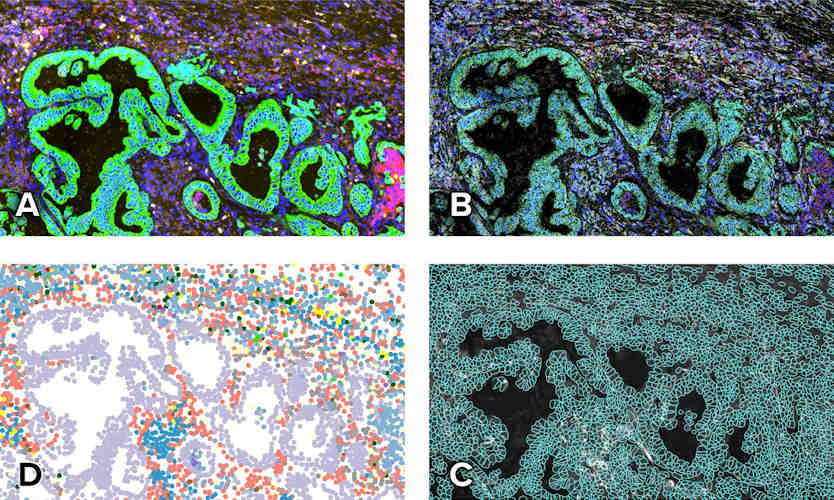
CosMx Spatial Molecular Imager (SMI) output on human lung cancer tissue. This platform images transcripts and proteins with single-cell resolution, enabling the creation of cell-type maps in situ. Here, immunofluorescence images (top, panels A and B) are used to delineate individual cells (panel C, cell boundaries in teal) and to identify cell types (panel D, colored by cell type). CosMx can profile ~1000 RNA targets and dozens of proteins simultaneously, helping build a spatial cell atlas of the tissue.
- Xenium In Situ – a high-throughput in situ transcriptomics platform from 10x Genomics. Xenium uses fixed probe panels and sequential imaging to map hundreds to thousands of RNA molecules with subcellular precision. It also supports multiplexed protein readouts. Xenium is designed for robustness and throughput, handling large tissue sections and outputting single-cell expression profiles mapped onto tissue images. In essence, it’s bringing 10x’s single-cell expertise into the tissue context, allowing researchers to zoom from tissue morphology down to single-cell gene activity.
- MERFISH and seqFISH – advanced in situ hybridization methods like MERFISH (Multiplexed Error-Robust FISH) pioneered spatial transcriptomics with single-cell resolution imaging of transcripts. MERFISH can profile hundreds of pre-selected genes in single cells across tissues, revealing fine spatial patterning of cell types. For instance, a recent whole-brain study used MERFISH to map neuron subtypes across the mouse brain. The limitation is gene throughput – hundreds to 1,000 genes vs. the whole transcriptome – but new chemistry and barcoding tricks (as in seqFISH+) are expanding these numbers. These methods nicely complement scRNA-seq: single-cell sequencing finds the full gene expression profiles (“the what”), and MERFISH pins those cell types to their locations (“the where”).
Each of these platforms brings unique strengths. Sequencing-based methods (Slide-seqV2, Stereo-seq) capture unbiased transcriptomes and scale to entire tissues, whereas imaging-based methods (CosMx, Xenium, MERFISH) achieve subcellular localization and can include protein co-detection. Crucially, they are complementary to scRNA-seq. Researchers can now obtain a single-cell atlas of all genes and know where each cell type resides in tissue – a multidimensional view that was not possible before. As these technologies mature, we anticipate “multimodal” experiments that combine them: for example, performing scRNA-seq to profile all gene expression and an imaging run (CosMx or Xenium) on adjacent tissue sections to map key transcripts/proteins back to spatial context. The synergy between scRNA-seq and spatial methods will yield far deeper insight than either alone.
Spatially Resolved Single-Cell Data at Scale
One clear trend is spatial transcriptomics catching up to single-cell RNA-seq in resolution and scale. Early spatial platforms (like Visium) captured spots containing many cells, but emerging ones reach single-cell or even sub-cellular granularity. This means we can start treating spatial data almost like another form of single-cell data – one that comes with x,y (and even z) coordinates. For instance, Slide-seqV2’s ~10 µm spots and Stereo-seq’s nanometer-scale positioning mean each “spot” is an individual cell or a part of a cell . In parallel, scRNA-seq has scaled to millions of cells across thousands of samples with ever-improving sensitivity. The convergence of these capabilities enables spatially resolved single-cell atlases – high-resolution maps of tissues where every dot is a cell with a rich gene profile.
An exemplar is the recent Mouse Brain Cell Atlas from the NIH BICCN consortium. Researchers profiled 32 million cells using scRNA-seq and spatial methods to build a complete map of the adult mouse brain. They identified ~5,300 distinct cell types and pinpointed each type’s location in the brain’s anatomy. Discoveries ranged from novel neuronal subtypes to spatially patterned gene expression linked to brain region function. Such an atlas was only possible by merging single-cell data (to define cell types by transcriptome) with spatial transcriptomics (to map those types in situ). This “cellular GPS” approach – defining what the cell is with scRNA-seq and where it is with spatial – is becoming a paradigm for tissue atlasing. Similar projects are underway for human organs through the Human Cell Atlas and related initiatives, which incorporate spatial transcriptomics to add anatomical context to single-cell references.
From a technology standpoint, achieving single-cell resolution in spatial data required innovations in chemistry and imaging. Techniques like Seq-Scope use patterned oligonucleotides on slides to reach sub-micron resolution – so precise that transcripts can be assigned to intracellular compartments (nucleus vs cytoplasm). Meanwhile, methods like sci-Space merge combinatorial indexing with spatial barcoding to label nuclei in place, then sequence them to get spatially tagged single-cell transcriptomes (Wang et al., 2024). The result is massive spatial single-cell datasets. As one example, a recent spatial atlas of a lymph node combined slide-based transcriptomics with single-cell sequencing to map immune cell niches across the entire organ in 3D, with over a hundred thousand cells identified in situ. Such studies herald an era where a single experiment can produce a rich cellular catalog along with a tissue map, effectively merging the benefits of a dissociated single-cell atlas and a histological tissue survey.
For researchers, this means experimental design is shifting. Rather than asking “should I do scRNA-seq or spatial?”, the answer will often be both. One can first perform high-throughput scRNA-seq on a tissue to discover cell types and gene programs, and then apply a spatial technique to visualize how those cell types are arranged and interact in the intact tissue. Or vice-versa: an imaging assay might reveal a striking spatial pattern (say a ring of cells expressing certain genes in a tumor), prompting deeper profiling of those cells by isolating them for single-cell sequencing. The two data types inform each other in an iterative loop. This complementary use is already evident in many cutting-edge studies and is expected to become routine.
Machine Learning and AI for Integrating Modalities
With great data comes great complexity: combining single-cell and spatial data yields enormous, high-dimensional datasets. To fully realize their power, we need computational methods that integrate these modalities and extract biologically meaningful information. Enter machine learning and AI, which are playing an ever-growing role in multimodal data integration.
Several specialized algorithms have been developed to map scRNA-seq data onto spatial coordinates. For example, cell2location is a Bayesian modeling tool that takes a reference scRNA-seq atlas of cell types and deconvolves spatial transcriptomics spots to estimate the abundance of each cell type in each location. Using cell2location, one can infer, say, how many T cells vs. B cells are likely present in each Visium spot of a lymph node slice, leveraging the rich cell-type definitions learned from scRNA-seq. Another tool, Tangram, uses deep learning to align single-cell gene expression profiles with spatial data (such as MERFISH images or spatial RNA-seq). Tangram essentially “projects” scRNA-seq data onto tissue, predicting which cell belongs where so that the spatial expression patterns best match the observed tissue data. These tools have been benchmarked on real organs – for instance, Tangram was used to place single cells into a mouse brain Visium dataset, successfully recovering known anatomical structures. The result of such integration is a comprehensive map where each spatial location is annotated with cell types or even whole single-cell transcriptomes, combining the strengths of both data sources.
Unsupervised machine learning is also crucial for data fusion and dimensionality reduction in multimodal single-cell datasets. The scVI (single-cell Variational Inference) framework uses deep neural networks to learn a latent representation of scRNA-seq data, which can be used for batch correction and integrating multiple experiments. Its extension totalVI does the same for CITE-seq data (joint RNA and protein measurements), learning a unified embedding of cellular states from combined transcriptomic and proteomic readouts. These probabilistic models help manage technical noise and dataset differences, enabling more straightforward integration of, say, a single-cell RNA atlas with an imaging-based spatial proteomics dataset. Other AI methods like graph neural networks and transformer models are being adapted to spatial biology as well. For example, methods like SpaGCN and STAGATE use graph convolutional networks to define spatial domains by considering both gene expression similarity and physical proximity of spots. These approaches can identify tissue substructures or gradients that might be missed by analyzing single-cell data alone. Likewise, emerging tools use histology images alongside spatial transcriptomics (leveraging computer vision) to refine the interpretation of spatial gene expression.
In summary, as data modalities multiply (single-cell RNA, spatial RNA, spatial protein, etc.), integration algorithms are the glue that binds them. We’re witnessing rapid progress in this area, often inspired by AI advances. The goal is a seamless analysis pipeline where you can feed in your dissociated single-cell data and your spatial data, and the algorithm will align them, correct biases, and output intuitive visualizations – like a tissue map annotated by cell types, or a 3D model of an organ where each cell’s gene expression is known. Projects in the near future might routinely create “digital twins” of tissues: computational reconstructions that unify all available data layers. None of this would be possible without sophisticated computation under the hood. Fortunately, tools like cell2location and Tangram are open-source and increasingly user-friendly, and they are already empowering researchers to make the most of combined datasets.
Spatial Multi-omics: Beyond RNA
Transcriptomics is only one piece of the cellular puzzle. The future is spatial multi-omics – measuring multiple biomolecular layers (RNA, protein, metabolites, epigenetic marks, etc.) together in intact tissues. If scRNA-seq and spatial transcriptomics are complementary, adding other omics layers can further enrich the picture.
Spatial proteomics is a natural addition, since proteins are the business end of gene expression. Techniques like imaging mass cytometry (e.g., Codex, MIBI) can stain dozens of proteins in tissue sections and image them, producing spatial maps of cell surface markers and signaling molecules. While these aren’t sequencing-based, they integrate nicely by identifying cell types or states that can be cross-referenced to transcriptomic data. In fact, platforms such as CosMx SMI already combine RNA and protein in one experiment, as discussed above. Similarly, 10x’s Xenium allows some proteins (through immunofluorescence) to be imaged alongside RNA transcripts. This is incredibly useful, for example, in tumors where protein markers (like immune checkpoints or phospho-proteins) might indicate cell state or drug response – we can now observe those in situ while also capturing gene expression.
Another multi-omic innovation is Digital Spatial Profiling (DSP), which uses photocleavable oligonucleotide tags to capture both protein and RNA from precise regions of interest. NanoString’s GeoMx DSP, for instance, lets you shine UV light on selected microscopic regions of a tissue (even as small as single cells) to release barcoded probes that report on tens of proteins or RNAs in those regions. This effectively gives a targeted multi-omic readout with spatial resolution defined by the region selection (which can be guided by histology). DSP has been applied in research on complex tissues like lymph nodes and tumors to correlate protein activity (e.g., immune activation markers) with local gene expression profiles (Wang et al., 2024).
On the sequencing side, deterministic barcoding in tissue sequencing (DBiT-seq) is a clever method that creates a grid of microscopic channels on a tissue and flows barcodes in two dimensions, assigning unique barcode pairs to small spots (like a chessboard). By also applying DNA-barcoded antibodies (for proteins) along with RNA capture, DBiT-seq can generate spatially resolved transcriptomes and proteomes concurrently. In essence, each tiny spot on the tissue (down to ~10 µm) gets a unique “address” and collects mRNAs and selected protein markers, which are then sequenced. The output is a data cube of genes x proteins x location. DBiT-seq was highlighted as one of “7 technologies to watch” in 2022, and it has been successfully used to map immune and tumor cell interactions, where both the mRNA of cells and the presence of protein markers (like T cell receptor proteins) are critical (Li et al., 2024).
Looking ahead, we can anticipate spatial assays for the epigenome as well. Assays that map DNA methylation or chromatin accessibility in situ are in early development. For example, techniques have been described to perform ATAC-seq on tissue slides (to find open chromatin regions spatially) and even multi-modal assays that combine ATAC and RNA on the same tissue slice. While still nascent, these could reveal how epigenetic regulation varies across a tissue – imagine seeing a map of active vs inactive chromatin domains across a developing embryo, or spotting epigenetic abnormalities in the microenvironment around a tumor. In parallel, spatial metabolomics (like imaging mass spectrometry) can detect metabolites and lipids in tissue sections, which could be layered on top of cell maps to study, say, nutrient gradients or signaling molecules in pathologic tissues.
The overarching vision is integrative: combine transcripts (which tell us what genes are on), proteins (what is actually being executed in cells), and epigenetics (how gene expression is regulated) in one spatially resolved framework. This would allow truly holistic studies – for example, in a section of heart tissue post-infarction, one could simultaneously observe which genes are upregulated, which cell signaling proteins are active, and how chromatin is remodeled in cells at the injury border versus far away. We are moving toward that goal step by step. Already, researchers have performed spatial multi-omic profiling of cancers that reveal, for instance, how a therapy target protein’s expression relates to the tumor’s transcriptional states and spatial niches (Hu et al., 2023). These insights are far richer than what any single modality could provide.
3D Spatial Modeling and Tissue Atlases
Biology happens in 3D. While most current spatial transcriptomics experiments are done on 2D tissue sections, an exciting frontier is building 3D models and atlases from serial sections or volumetric methods. The human body is composed of organs with complex three-dimensional architecture – capturing that in our molecular maps is the next challenge.
One approach is to take multiple consecutive thin sections and apply spatial transcriptomics to each, then computationally stitch them together in 3D. New software like STitch3D uses joint modeling and machine learning to align features across slices and reconstruct a 3D volume with cellular resolution (Ali et al., 2023). For example, a 3D atlas of a whole mouse embryo was constructed by combining dozens of slice datasets, yielding a time-lapse of gene expression in 3D space as the embryo develops. Another group recently mapped an entire lymph node in 3D, identifying how B and T cell zones extend and connect through the volume – something that a single slice would miss due to sectioning plane. These efforts show the feasibility of scaling from 2D to 3D.
There are also technologies aiming for direct 3D capture. Open-SPIM and light-sheet microscopy can perform in situ sequencing in thicker samples or cleared tissues. An approach called STARmap achieved 3D intact-tissue RNA sequencing using a hydrogel-tissue chemistry, reading 3D coordinates of transcripts in a block of brain tissue. Meanwhile, the earlier-mentioned Open-ST method not only improves 2D resolution (down to ~0.6 µm, practically subcellular) but also provides pipelines for 3D reconstruction of tissues. In demonstrations, Open-ST was used to build a virtual 3D model of a metastatic tumor in a lymph node, containing over a million cells, which allowed researchers to identify 3D spatial patterns of gene expression not evident in 2D. For instance, they found a shell of macrophages wrapping around tumor regions in 3D and a gradient of a cholesterol biosynthesis pathway at the tumor-lymph interface – novel findings that advance understanding of cancer biology.
Large-scale atlas projects are embracing 3D to create reference maps for entire organs and organisms. The aforementioned Mouse Brain atlas is effectively a 3D map (the data covers the whole brain volume). The NIH’s HuBMAP (Human Biomolecular Atlas Program) explicitly aims to build a 3D atlas of the human body at the cellular level. They are compiling organ by organ, integrating data from multiple modalities (including spatial transcriptomics, imaging, and single-cell sequencing) into common coordinate frameworks for each tissue. The ultimate outcome may be an interactive atlas where one can zoom into any organ, then any region, and see the cells and their molecular profiles – essentially Google Maps for the human body, down to single-cell detail.
Tissue atlases like these are invaluable for the next generation of biology and medicine. They serve as references to compare against (e.g., comparing a patient’s tumor to a reference atlas to see what’s different), and they provide context for interpreting results (e.g., if a gene is expressed in a certain rare cell type in disease, an atlas can show where that cell type normally resides and what it does). Atlases also accelerate discovery: In drug development, knowing the spatial distribution of all cell types can highlight which cells to target and where. For example, an atlas of the lung might reveal a specific niche of fibroblasts near airways that drive fibrosis – a precise therapeutic target. As noted in one of our use-case articles, comprehensive cell atlases built with scRNA-seq and spatial methods are “accelerating target validation, improving trial design, and inspiring new therapies” (Read: Nygen Technology). They give pharmaceutical researchers a blueprint of cell types and states to guide interventions.
The convergence of 3D atlases and multi-modal data is truly the next-generation roadmap for biology. We are effectively moving from sequencing cells in a tube, to mapping cells in tissue, to reconstructing entire organs with all their molecular complexity. It’s a breathtaking expansion of scale and detail. This future will rely on the continued interplay of single-cell sequencing (to deeply profile each cell) and spatial techniques (to situate each cell). Together, they allow us not just to list the parts, but also to see how the parts are assembled into functioning biological systems.
A Unified Future: Merging Single-Cell and Spatial Insights
Taken together, these trends paint a future where single-cell RNA-seq and spatial transcriptomics are fully integrated in research workflows. Rather than viewing them as separate options, scientists will use them as complementary tools – much like a paired set of lenses – to examine biological questions from multiple angles. This is already apparent in cutting-edge studies. For instance, in developmental biology, researchers might use scRNA-seq to define all the cell states in an embryo and use spatial mapping to see how those states arrange to form tissues and organs. In neuroscience, single-cell profiling might identify neuron subtypes, while spatial data reveals the circuitry (which neuron types connect where). In oncology, scRNA-seq can find a rare drug-resistant tumor cell population, and spatial analysis can show whether those cells cluster in certain tumor regions or niches (perhaps near blood vessels or hypoxic zones).
Using both modalities together provides a more holistic understanding: the cellular parts list and the assembly instructions. We can answer nuanced questions like “which cell-cell interactions drive a process?” by seeing cells in proximity (from spatial data) and knowing what signals they express (from single-cell data). We can also attain higher confidence in discoveries – if a new cell type is identified by scRNA-seq, spatial validation can confirm it exists in tissue and see what it’s doing there. Conversely, if spatial data hints at an interesting region or structure (say a gradient of gene expression across a tissue), single-cell data can explain it by revealing the underlying cell composition or state changes.
Importantly, the barriers to using both are coming down. Technological and cost hurdles are lowering, and integrated analysis methods are improving (as discussed with AI tools). This means even smaller labs and diverse projects can feasibly incorporate both single-cell and spatial experiments. Just as today it’s common to perform multi-replicate scRNA-seq or to integrate multi-omics (like RNA-seq and ATAC-seq) in a study, we predict that in the near future it will be routine to include a spatial transcriptomics component in any single-cell study of tissues. The academic culture is shifting toward multi-modal evidence; papers are more frequently expected to show both the cellular composition and the spatial architecture of a biological system to support a claim.
Another factor is the rise of user-friendly platforms and pipelines for multimodal data. This is where Nygen and similar platforms enter the scene.
Nygen: A Flexible Hub for Multimodal Transcriptomics
As the complexity of experiments grows, researchers need integrated software environments to manage and analyze their data. Nygen Analytics was built with this multimodal future in mind. It is a cloud-based platform for comprehensive single-cell and spatial data analysis. Nygen is technology-agnostic – it supports data from droplet scRNA-seq, plate-based methods, CITE-seq (RNA+protein), BCR/TCR sequencing, and importantly spatial transcriptomics visualization. This means you can bring together your 10x Chromium single-cell gene expression data, your 10x Visium spatial slide, maybe some CITE-seq measurements, all into one place. The platform is designed to be extensible and flexible, reflecting the fast pace of new techniques.
Key features of Nygen that empower multimodal analysis include: advanced dataset merging and integration tools, extensive metadata handling, and an intuitive visualization interface. For example, you can merge a single-cell gene expression matrix with a spatial dataset and jointly visualize them – perhaps plotting the single-cell derived clusters onto the spatial tissue map. Batch correction and integration algorithms (like those in scVI-tools) are built-in, allowing alignment of data from different modalities or experiments. The platform also supports version tracking, so as you iterate on analyses (trying different integration parameters, for instance) you can keep track of results. This is crucial in multimodal projects where one might test multiple methods to link datasets (e.g., comparing cell2location vs Tangram outputs).
From an ease-of-use perspective, Nygen lowers the entry barrier for complex analysis. It’s entirely browser-based – no installation required, and compute scaling is handled in the cloud. Large spatial images or single-cell matrices can be heavy to handle on local machines, but Nygen’s cloud infrastructure manages it and executes analyses immediately (no queueing). This lets researchers focus on interpreting results rather than wrangling tools or waiting for pipelines to finish. Real-time collaboration is another boon: teams can share data and interactive results via the platform, which is particularly helpful when integrating diverse expertise (e.g., a sequencing expert and a pathologist can look at the data together). Furthermore, Nygen’s visualization suite is geared for both single-cell and spatial data – UMAP plots, heatmaps, and cluster annotations for scRNA-seq, alongside importing spatial coordinates and visualization all available in one place. You can, for instance, click on a cluster of cells in the UMAP and immediately see where those cells are located on the tissue, linking cluster identity to spatial context seamlessly.
As multi-omics becomes commonplace, Nygen is also positioned as a hub to incorporate new data types. Its extensible design means support for, say, spatial proteomics or cell-cell interaction analysis can be added as those methods mature. The Nygen Database provides a repository of curated public single-cell datasets (with plans to include spatial datasets), allowing users to explore published data or even combine public atlas data with their own. Imagine loading a reference atlas from Nygen Database and using Nygen’s tools to map your new experiment onto it – effectively leveraging community data for integrative analysis. This kind of workflow accelerates science, as researchers don’t have to start from scratch when interpreting their results.
Throughout this 3-part series, we highlighted the accelerating advances in transcriptomics. Nygen’s mission is to ensure that as these advances occur, researchers have an accessible, powerful platform to harness them. Whether you are designing a single-cell experiment (see our guide on designing robust scRNA-seq experiments in Part 1) or visualizing a complex spatial dataset (as covered in Part 2), or now integrating multi-modal data, Nygen provides the infrastructure to do so efficiently. The platform’s flexibility, extensibility, and ease-of-use mirror the needs of modern scientists who must be nimble in adapting to new data types and analysis paradigms. By unifying scRNA-seq and spatial analysis, Nygen helps break down data silos and encourages holistic exploration – exactly what is needed as biology enters this new multimodal era.
Conclusion: Charting the Next-Generation of Biology
Spatial transcriptomics and single-cell RNA-seq began as separate innovations, each transformative on its own. Now, as we look to the future, these technologies are converging into a complementary toolkit that will drive the next wave of biological discovery. The frontier is rich: new platforms are delivering unprecedented data, from subcellular transcript maps to multi-omic tissue profiles and 3D organ reconstructions. With these tools, researchers can pose ambitious questions – mapping entire developmental processes cell by cell, deciphering the cellular ecosystems of diseases, and discovering how cellular context influences function in health and pathology.
The three parts of this series have taken us from the fundamentals of single-cell sequencing, through the advent of spatial mapping, to this future-focused vision of integrated, next-generation biology. A consistent theme is that context matters: the identity of a cell (revealed by scRNA-seq) and its location and neighbors (revealed by spatial methods) together give a fuller picture of biology than either alone. As methods for integration improve and become routine, we will see combinatorial insights – for example, not just finding a new cell type, but understanding its role in tissue by seeing its spatial interactions and multi-omic phenotype. This holistic perspective is crucial for tackling complex problems like tissue regeneration, neurological disorders, immune responses, and cancer. It’s akin to moving from isolated notes to a symphony; we want to hear how all the molecular players come together in concert within the organism.
Nygen’s platform exemplifies how we can practically achieve this synergy in our research. By serving as a central hub for multimodal analysis, it allows scientists to plug in diverse data and immediately start integrating and visualizing. The flexibility to handle whatever new data type tomorrow brings means it’s a future-proof partner as the field evolves. Our series closes with optimism that the marriage of single-cell and spatial transcriptomics will unravel mysteries that were previously out of reach. From building comprehensive cell atlases to accelerating drug discovery, the implications are vast. As you plan your next experiments, consider how you might incorporate both single-cell and spatial approaches – and how you will analyze them side by side. The tools are ready, and the biological possibilities are endless.
In conclusion, spatial transcriptomics and scRNA-seq are no longer parallel tracks but rather intertwined strands of the same thread, weaving a richer tapestry of understanding in molecular biology. Equipped with these complementary technologies and robust platforms like Nygen for analysis, researchers are poised to explore uncharted territories of the cellular world, driving forward the frontiers of next-generation biology.
References
Meng, F., Aierken, A., Li, F., Chen, X., Xu, M., Gao, X., Wang, J., & Wang, Y. (2024). Advances in spatial transcriptomics technologies and applications in cancer research. Frontiers in Cell and Developmental Biology, 12, 1378875.https://doi.org/10.3389/fcell.2024.1378875
Fortner, A., & Bucur, O. (2024). Multiplexed spatial transcriptomics methods and the application of expansion microscopy. Cell Reports Methods, 4(3), 100709.https://doi.org/10.1016/j.crmeth.2024.100709
Wang, J., Li, K., Sun, R., Gao, H., Lu, Y., Li, Y., & Li, X. (2024). Spatially resolved transcriptomics: unleashing precision medicine in colorectal cancer. Molecular Cancer, 23, 64.https://doi.org/10.1186/s12943-024-02040-9
Li, B., Li, F., Li, F., Xin, X., Gao, X., Zhang, X., & Lin, C. (2024). Advancing spatially resolved transcriptomics technologies for clinical applications: a systematic review. Genome Medicine, 16, 15.https://doi.org/10.1186/s13073-024-01282-y
Hu, J., Jacobs, J., Sinha, N., Greene, C. S., Karagiannis, L., Lam, K., Linderman, G. C., Parsana, P., Ruffin, D., Shah, P., Tran, D., Wang, K., Wang, Y. C., Zimmermann, M. T., Wren, J., Carter, G. W., Voichek, Y., Welch, J. D., & Nawy, T. (2023). Spatial transcriptomics reveals distinct and overlapping functions of cancer–immune microenvironments with impacts on biology and therapy response. Nature Communications, 14, 4526.https://doi.org/10.1038/s41467-023-40271-4
Related articles

Integrating Multi-Omics Data for Effective Target Identification in Drug Discovery
Discover how multi-omics integration is reshaping drug discovery by uncovering disease mechanisms, prioritizing drug targets, and connecting genomics, epigenomics, transcriptomics, proteomics, and metabolomics into a usable biological model.
Read more →
Enriching Insights with Single-cell RNA-seq: Integrating Spatial Data Strategically
Discover how integrating spatial transcriptomics with scRNA-seq data enhances biological insights by mapping gene expression to tissue architecture. Learn key integration methods and real-world applications.
Read more →
When is Single-cell RNA-seq Enough? Practical Guidance for Choosing Your Analysis Method
Discover when single-cell RNA sequencing is sufficient for your research needs. This guide explains ideal use cases, analysis techniques, and practical implementations for leveraging scRNA-seq data effectively.
Read more →