Navigating the Complexity of Single-Cell RNA-Seq Data Analysis
Explore key challenges and advanced strategies in scRNA-seq data analysis for both new and experienced researchers.
Single-cell RNA-seq analysis can be challenging because each downstream step depends on the quality of the one before it. Quality control choices affect normalization, normalization affects clustering, and clustering affects biological interpretation. A practical way to navigate the workflow is to break it into a set of linked decisions and evaluate each one with the right metrics.
Quality Control
Implement stringent quality control (QC) measures to ensure data reliability before moving into downstream analysis.
Cell-Level QC Metrics
- Total UMI Counts: Filter out cells with extremely low or high unique molecular identifier (UMI) counts, which may represent empty droplets or cell multiplets.
- Number of Detected Genes: Exclude cells expressing very few genes, as they may be dead or dying.
- Mitochondrial Gene Percentage: High mitochondrial RNA content often indicates cell stress or apoptosis.
- Doublet Correction: Use tools like Scrublet or scDblFinder to identify and remove doublets.
- Ambient RNA Correction: Correct for ambient RNA contamination using tools like SoupX.
Gene-Level QC Metrics
- Remove genes expressed in very few cells to reduce noise.
Tools like Seurat and Scanpy provide functions to compute these metrics and filter data accordingly.
Normalization
Choose appropriate normalization methods to adjust for technical variability.
- Global Scaling (Log-Normalization): Compute counts per cell, scale to a common library size, and log-transform to stabilize variance.
- Pooling-Based Normalization: Scran uses deconvolution to estimate cell-specific biases in complex datasets.
- CLR Normalization: Centered Log Ratio (CLR) normalization is often used for datasets like CITE-seq to normalize data across cells.
The choice of normalization affects downstream analyses, so it is crucial to select a method that matches your data and analytical goals.
Dimensionality Reduction
Apply dimensionality reduction techniques to simplify data while retaining essential variation.
- Principal Component Analysis (PCA): Identifies the directions, or principal components, that capture the most variance.
- t-Distributed Stochastic Neighbor Embedding (t-SNE): Preserves local structures for visualization in two or three dimensions.
- UMAP: Preserves both local and global data structure while often offering faster computation and clearer visualization.
PCA and UMAP are often used together to simplify data for clustering and visualization, providing complementary insights.
Clustering
Use clustering methods suited for scRNA-seq data.
Graph-Based Clustering
- Leiden is one of the most widely used algorithms, operating on k-nearest neighbor graphs to efficiently identify clusters.
Metrics for Clustering Quality
Assess clustering quality using metrics like Silhouette Score and Adjusted Rand Index (ARI).
Selecting the appropriate algorithm depends on dataset size, computational resources, and the desired clustering resolution.
Batch Correction and Data Integration
Employ batch correction and data integration techniques when comparing datasets across samples, conditions, or studies.
- Harmony: Aligns subpopulations across datasets while preserving biological variation.
- Seurat Integration: Uses canonical correlation analysis (CCA) and mutual nearest neighbors for dataset alignment.
- Mutual Nearest Neighbors (MNN) Correct: Corrects batch effects by identifying shared cell populations across batches.
Metrics for Batch Correction
Use metrics like LISI score (Local Inverse Simpson's Index) and Entropy of Batch Mixing to assess batch correction quality.
Proper correction ensures that downstream analyses reflect true biological differences rather than technical artifacts.
Statistical Testing
Utilize statistical methods tailored for scRNA-seq data.
- Zero-Inflated Models: MILO provides a robust approach for analyzing differential abundance and differential expression across cell populations.
- Non-Parametric Tests: The Wilcoxon rank-sum test is commonly used for scRNA-seq analyses because it is robust to non-normal distributions.
- Multiple Testing Correction: Apply methods like Benjamini-Hochberg to control the false discovery rate.
Accurate statistical testing is critical for identifying biologically meaningful differentially expressed genes.
Multi-Omics Integration
Combine datasets effectively for comparative and multi-modal studies.
- MOFA+: A factor analysis approach to integrate multi-modal single-cell datasets such as transcriptomics and proteomics.
- scANVI: A variational inference model designed for data integration and harmonization.
- Seurat's Weighted Nearest Neighbor (WNN) and totalVI: Useful for integrating multi-omics data.
- Universal Cell Embedding (UCE): Facilitates cross-species dataset integration.
Integration enhances analytical power and the generalizability of findings.
Related articles
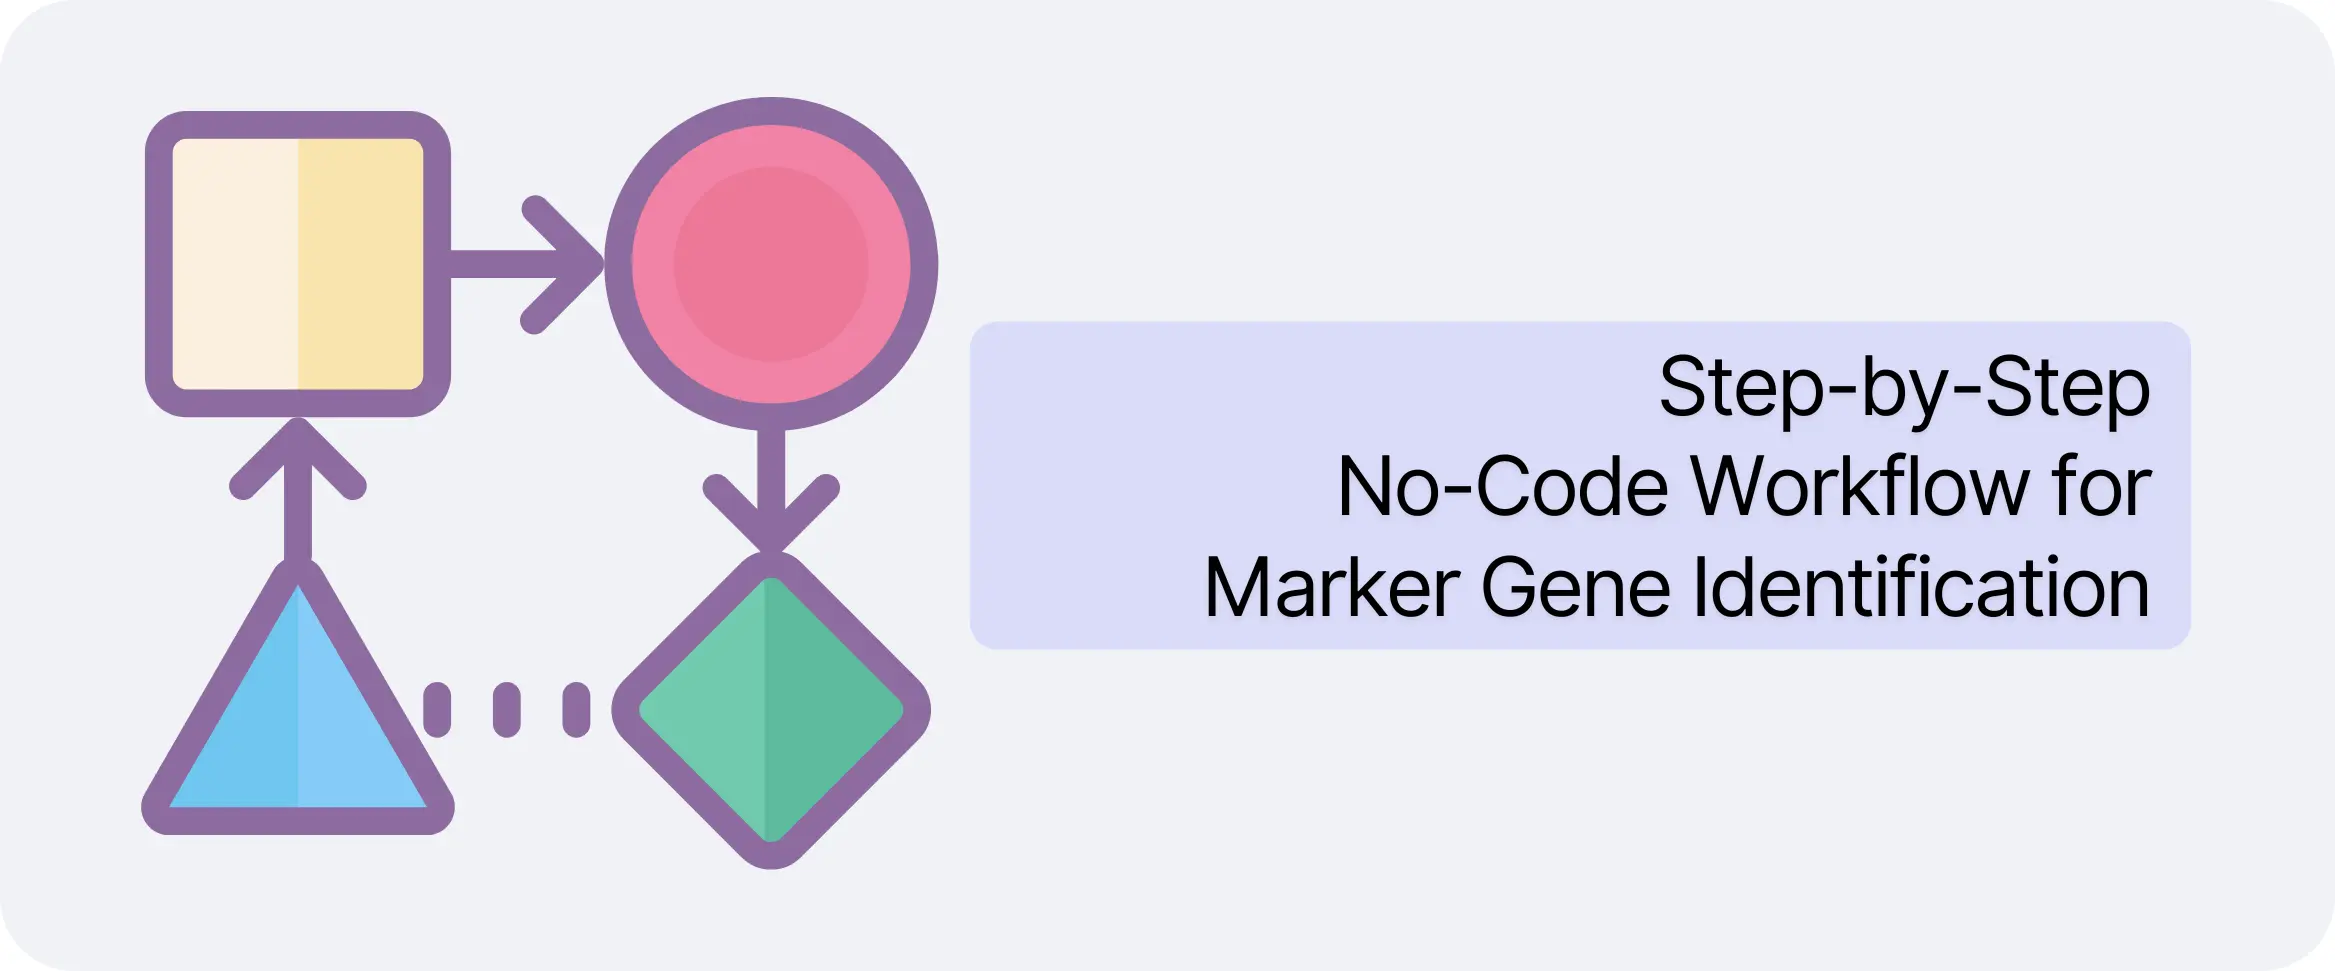
No-Code Workflow for Marker Gene Identification (Step-by-Step) on Nygen
Learn how to identify marker genes in single-cell RNA-seq data without coding using Nygen's intuitive platform. This step-by-step guide covers data upload, quality control, clustering, marker detection, and dynamic analysis with detailed screenshots and expert tips.
Read more →
Accelerate Marker Gene Detection in scRNA-seq: A No-Code Approach
Uncover the essentials of marker gene identification in single-cell RNA sequencing. This article covers no-code solutions, methodologies, and case studies across various fields.
Read more →
Understanding Batch Effect and Normalization in scRNA-Seq Data
Compare scRNA-seq normalization and batch correction methods, with current Seurat, Scanpy, Monocle 3, scran, Harmony, BBKNN and scVI workflows.
Read more →